佬们,有什么软件或者插件能直观的看到处理claude code的缓存命中情况吗

我用的是订阅,没有别的插件能看到命中率吗
那就很难整了吧… 看看有没有别的佬友 给答案
如果是调用api的话,返回的event里面会有cache字段的,这个字段的值就是命中token数。
订阅有办法嘛?
我前段时间vibecoding了一个自用工具,晚点可以公开一下
这个我就不太清楚了
期待佬共享
cc的 /statusline 里面是可以设置的
/statusline what kind of info can i show using statusline

in the token counts section am I able to see the cached tokens?

....

{{多问几轮}}
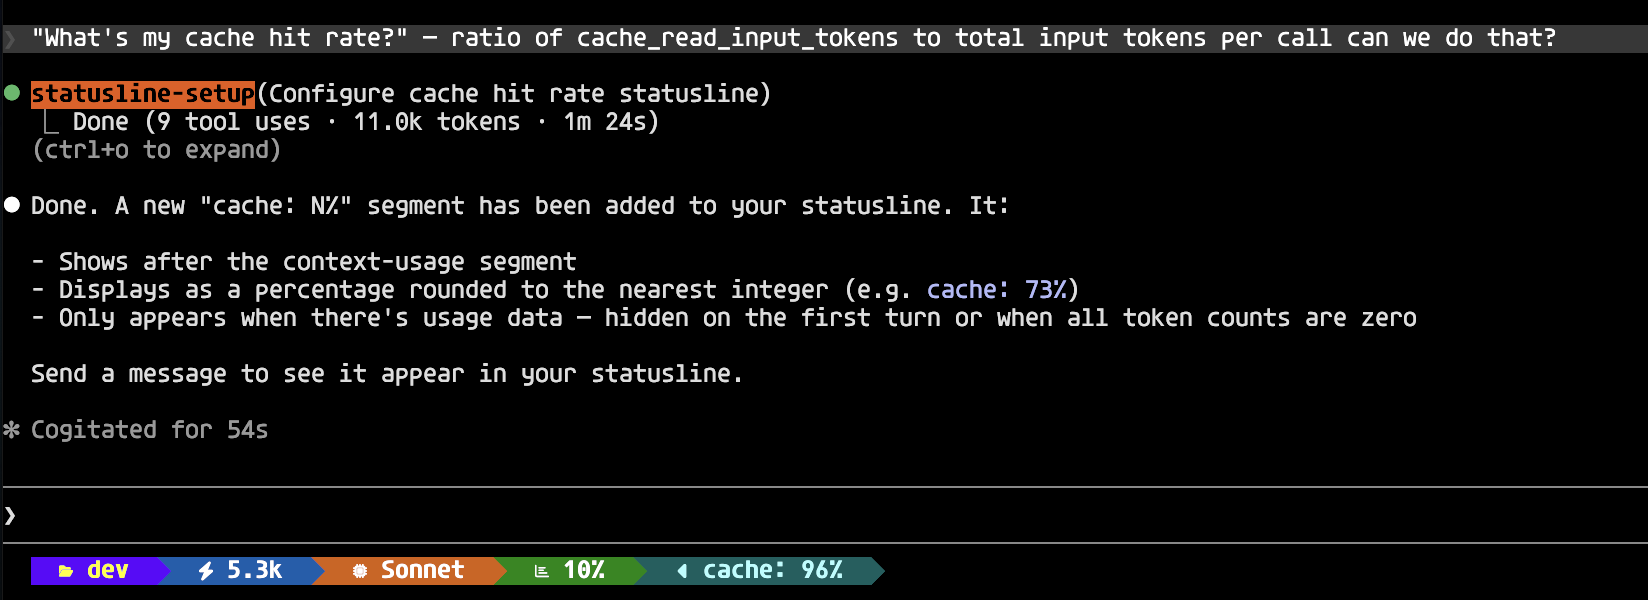
还行 可以加这个 Segment
我用来提醒5分钟缓存是否到期的,其他都是附带的功能,不知道是否满足你的需求
其实不用看,你就知道只要对话间隔不超过5分钟,Claude Code的缓存命中率都在99%到100%之间。超过5分钟缓存失效
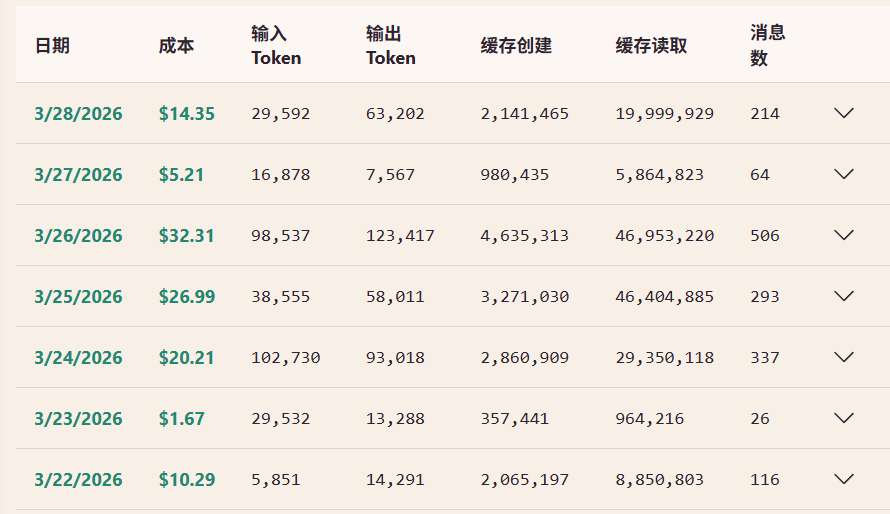
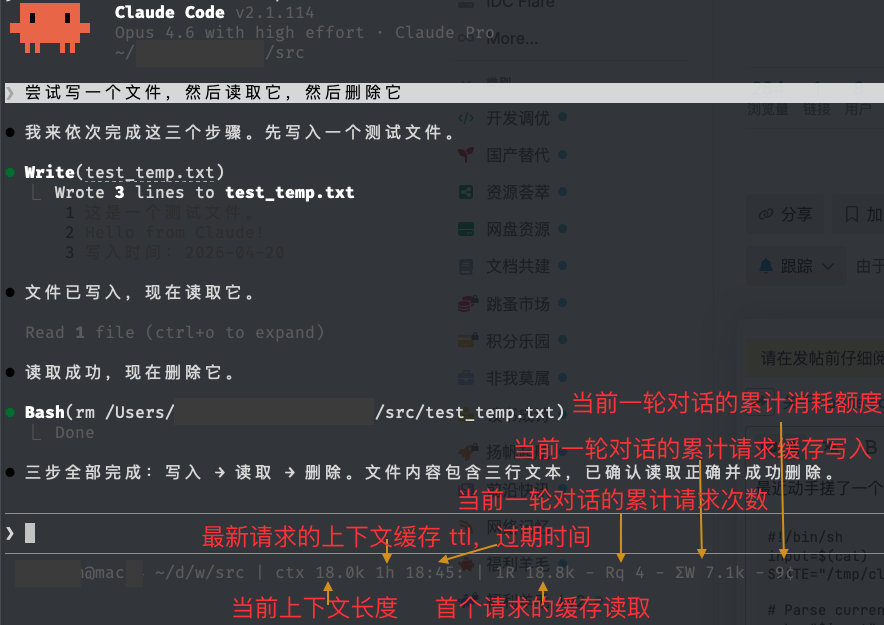
最近动手搓了一个,已经非常稳了。
#!/bin/sh
input=$(cat)
STATE="/tmp/claude-sl-state.json"

# Parse current data
echo "$input" > /tmp/claude-sl-debug.json
session_id=$(echo "$input" | jq -r '.session_id')
transcript=$(echo "$input" | jq -r '.transcript_path // ""')
total_out=$(echo "$input" | jq '.context_window.total_output_tokens')
cr=$(echo "$input" | jq '.context_window.current_usage.cache_read_input_tokens')
cw=$(echo "$input" | jq '.context_window.current_usage.cache_creation_input_tokens')
used_pct=$(echo "$input" | jq '.context_window.used_percentage')
win_size=$(echo "$input" | jq '.context_window.context_window_size')
cwd=$(echo "$input" | jq -r '.cwd')
cost_usd=$(echo "$input" | jq '.cost.total_cost_usd // 0')
user=$(whoami)
host=$(scutil --get ComputerName 2>/dev/null || hostname -s)
now=$(date +%s)

# Transcript metrics: turns, nreq, fr, fr_dip, tw (parsed with jq to avoid grep false positives)
turns=0; _t_nreq=0; _t_fr=0; _t_fr_dip=0; _t_tw=0
if [ -n "$transcript" ] && [ -f "$transcript" ]; then
  _metrics=$(jq -s '
    . as $arr |
    ([$arr[] | select(.type == "user" and (.message.content | type) == "string")] | length) as $turns |
    (reduce range($arr | length) as $i (null;
      if $arr[$i].type == "user" and ($arr[$i].message.content | type) == "string"
      then $i else . end
    )) as $last_user |
    if $last_user == null then {turns: $turns, nreq: 0, fr: 0, fr_dip: false, tw: 0}
    else
      # All assistant responses after the last user turn, deduped by message.id.
      # fr defaults to first request cache_read ("1R"); if any later request
      # within the turn reads meaningfully less, fr drops to the low-water-mark
      # and fr_dip flips the label to "∧R".
      #
      # Threshold = N_BLOCKS * BLOCK_SIZE (default 3 * 4096 = 12288 tokens).
      # Rationale: Anthropic caches at a fixed block granularity (~4k for Opus
      # 4.x). Claude Code reshuffles its cache_control breakpoints between
      # consecutive requests in a turn, which routinely orphans 1–2 blocks
      # (observed ≤8k drops in real transcripts — normal reorg, not degradation).
      # A drop of ≥3 blocks is outside the normal reorg band and signals real
      # backend cache loss (TTL expiry, LRU eviction). A percentage component
      # was intentionally dropped: reorg cost scales with block_size, not cache
      # size, so a relative threshold would mis-flag routine 1-block reorgs on
      # large caches. Bump N_BLOCKS if you see false positives; lower it if
      # real eviction events are slipping through.
      [$arr[($last_user + 1):] | .[] | select(.type == "assistant" and .message.id)]
      | unique_by(.message.id) as $msgs |
      ($msgs[0].message.usage.cache_read_input_tokens // 0) as $first |
      ([$msgs[] | .message.usage.cache_read_input_tokens // 0] | min // 0) as $mincr |
      (($first - $mincr) >= 12288) as $dip |
      {turns: $turns, nreq: ($msgs | length),
       fr: (if $dip then $mincr else $first end),
       fr_dip: $dip,
       tw: ([$msgs[] | .message.usage.cache_creation_input_tokens] | add // 0)}
    end
  ' "$transcript" 2>/dev/null)
  if [ -n "$_metrics" ]; then
    turns=$(echo "$_metrics" | jq '.turns')
    _t_nreq=$(echo "$_metrics" | jq '.nreq')
    _t_fr=$(echo "$_metrics" | jq '.fr')
    _t_fr_dip=$(echo "$_metrics" | jq 'if .fr_dip then 1 else 0 end')
    _t_tw=$(echo "$_metrics" | jq '.tw')
  fi
fi

# Load state
if [ -f "$STATE" ]; then
  prev_sid=$(jq -r '.sid // ""' "$STATE")
  prev_out=$(jq '.out // 0' "$STATE")
  nreq=$(jq '.nreq // 0' "$STATE")
  fr=$(jq '.fr // 0' "$STATE")
  fr_dip=$(jq '.fr_dip // 0' "$STATE")
  tw=$(jq '.tw // 0' "$STATE")
  ttl=$(jq -r '.ttl // ""' "$STATE")
  ttl_exp=$(jq '.ttl_exp // 0' "$STATE")
  prev_turns=$(jq '.turns // 0' "$STATE")
  last_t=$(jq '.t // 0' "$STATE")
  prev_cost=$(jq '.prev_cost // 0' "$STATE")
  tc=$(jq '.tc // 0' "$STATE")
else
  prev_sid=""; prev_out=0; nreq=0; fr=0; fr_dip=0; tw=0; ttl=""; ttl_exp=0; prev_turns=0; last_t=0; prev_cost=0; tc=0
fi

# Session change → full reset
if [ "$session_id" != "$prev_sid" ]; then
  prev_out=0; nreq=0; fr=0; fr_dip=0; tw=0; ttl=""; ttl_exp=0; prev_turns=$turns; last_t=$now; tc=$cost_usd; prev_cost=$cost_usd
fi

# New turn detected → update turn-start cost baseline
if [ "$turns" -gt "$prev_turns" ] 2>/dev/null; then
  tc=$prev_cost
fi

# Apply transcript-based metrics (overrides state values)
if [ "$_t_nreq" -gt 0 ] 2>/dev/null; then
  nreq=$_t_nreq; fr=$_t_fr; fr_dip=$_t_fr_dip; tw=$_t_tw
elif [ "$turns" -gt "$prev_turns" ] 2>/dev/null; then
  # New turn started but no assistant response yet → reset
  nreq=0; fr=0; fr_dip=0; tw=0
fi

# Turn cost = current session total - turn start baseline
turn_cost=$(echo "$cost_usd - $tc" | bc -l 2>/dev/null || echo "0")

# Detect new API request (for trace logging and TTL extraction)
if [ "$total_out" != "$prev_out" ]; then
  elapsed=$((now - last_t))
  last_t=$now
  # Extract cache TTL tier from transcript (last assistant message)
  if [ -n "$transcript" ] && [ -f "$transcript" ]; then
    _tier=$(tail -20 "$transcript" | tail -r | while IFS= read -r _line; do
      _t=$(echo "$_line" | jq -r '.type // empty' 2>/dev/null)
      if [ "$_t" = "assistant" ]; then
        _1h=$(echo "$_line" | jq '.message.usage.cache_creation.ephemeral_1h_input_tokens // 0')
        _5m=$(echo "$_line" | jq '.message.usage.cache_creation.ephemeral_5m_input_tokens // 0')
        if [ "$_1h" -gt 0 ] 2>/dev/null; then echo "1h"
        elif [ "$_5m" -gt 0 ] 2>/dev/null; then echo "5m"
        fi
        break
      fi
    done)
    [ -n "$_tier" ] && ttl="$_tier"
  fi
  # Refresh cache expiration anchor whenever a new request lands — Anthropic
  # refreshes prompt-cache TTL on every read, so `now + tier_duration` is the
  # real-world expiry. Rendered as wall-clock time in the output block below.
  case "$ttl" in
    1h) ttl_exp=$((now + 3600)) ;;
    5m) ttl_exp=$((now + 300)) ;;
  esac
  # Trace: capture full current_usage + cost
  uncached=$(echo "$input" | jq '.context_window.current_usage.input_tokens')
  out_tokens=$(echo "$input" | jq '.context_window.current_usage.output_tokens')
  total_in=$(echo "$input" | jq '.context_window.total_input_tokens')
  echo "$(date '+%Y-%m-%d %H:%M:%S') REQ#${nreq} elapsed=${elapsed}s total_out=${prev_out}->${total_out} | current_usage: R=${cr} W=${cw} U=${uncached} out=${out_tokens} | totals: in=${total_in} out=${total_out} | cost=\$${cost_usd} | state: fr=${fr} tw=${tw}" >> /tmp/claude-sl-trace.log
fi

# Save state (t = last request time, not last poll time)
jq -n --arg sid "$session_id" --argjson out "$total_out" \
  --argjson nreq "$nreq" --argjson fr "$fr" --argjson fr_dip "$fr_dip" --argjson tw "$tw" \
  --arg ttl "$ttl" --argjson ttl_exp "$ttl_exp" \
  --argjson turns "$turns" --argjson t "$last_t" \
  --argjson prev_cost "$cost_usd" --argjson tc "$tc" \
  '{sid:$sid, out:$out, nreq:$nreq, fr:$fr, fr_dip:$fr_dip, tw:$tw, ttl:$ttl, ttl_exp:$ttl_exp, turns:$turns, t:$t, prev_cost:$prev_cost, tc:$tc}' > "$STATE"

# Format path: abbreviate each component except the last to its first letter
# /Users/justin/dev26/colab-runtime-2/colab-cli → ~/d/c/colab-cli
fmt_path() {
  _p="$1"
  _home="$HOME"
  case "$_p" in
    "$_home") echo "~"; return ;;
    "$_home"/*) _p="~/${_p#$_home/}" ;;
  esac
  case "$_p" in
    */*) : ;;
    *) echo "$_p"; return ;;
  esac
  _base="${_p##*/}"
  _dir="${_p%/*}"
  _out=""
  case "$_p" in
    /*) _out="/" ;;
  esac
  _dir="${_dir#/}"
  while [ -n "$_dir" ]; do
    case "$_dir" in
      */*) _seg="${_dir%%/*}"; _dir="${_dir#*/}" ;;
      *)   _seg="$_dir"; _dir="" ;;
    esac
    _first=$(printf '%s' "$_seg" | cut -c1)
    _out="${_out}${_first}/"
  done
  echo "${_out}${_base}"
}

# Format token count (19317 → 19.3k)
fmt() {
  if [ "$1" -ge 1000 ] 2>/dev/null; then
    printf "%.1fk" "$(echo "$1 / 1000" | bc -l)"
  else
    echo "${1:-0}"
  fi
}

# Format cost (0.1234 → 12¢, 1.234 → $1.23)
fmt_cost() {
  echo "$1" | awk '{c=$1; if(c<0.01) printf "0¢"; else if(c<1) printf "%d¢",c*100+0.5; else printf "$%.2f",c}'
}

# Context: approximate used tokens from percentage
used_tokens=$(( win_size * used_pct / 100 ))

# Output

# TTL tag format: "<tier> <expiry>" — e.g. "1h 17:36:" or "5m :41:40".
# 1h tier shows HH:MM: (wall-clock hour:minute with trailing colon);
# 5m tier shows :MM:SS (leading colon + minute:second of expiry wall-clock).
# Expiry suffix is suppressed if the anchor has already passed (shows bare
# tier instead).
ttl_tag=""
if [ -n "$ttl" ]; then
  ttl_tag=" ${ttl}"
  if [ "$ttl_exp" -gt "$now" ] 2>/dev/null; then
    case "$ttl" in
      1h) ttl_tag="${ttl_tag} $(date -r "$ttl_exp" "+%H:%M:")" ;;
      5m) ttl_tag="${ttl_tag} $(date -r "$ttl_exp" "+:%M:%S")" ;;
    esac
  fi
fi

# Cache-read label: "1R" = first request of the turn (warm baseline);
# "∧R" = low-water-mark, flipped when any later request in the turn reads
# fewer cached tokens than the first (signals mid-turn cache degradation).
if [ "$nreq" -gt 0 ]; then
  r_label="1R"
  [ "$fr_dip" = "1" ] && r_label="∧R"
  echo "${user}@${host} $(fmt_path "$cwd") | ctx $(fmt "$used_tokens")${ttl_tag} | ${r_label} $(fmt "$fr") - Rq ${nreq} - ΣW $(fmt "$tw") - $(fmt_cost "$turn_cost")"
else
  echo "${user}@${host} $(fmt_path "$cwd") | ctx $(fmt "$used_tokens")"
fi
保存为 statusline-command.sh 放在 ~/.claude/ 路径下,然后 chmod u+x ~/.claude/statusline.command.sh 就装上了。
感谢佬的脚本!我在这个脚本的基础上做了点 linux 适配,并提高了 ctx 精度之后就直接用上了 
#!/bin/sh
input=$(cat)
STATE="/tmp/claude-sl-state.json"

# Parse current data
echo "$input" > /tmp/claude-sl-debug.json
session_id=$(echo "$input" | jq -r '.session_id')
transcript=$(echo "$input" | jq -r '.transcript_path // ""')
total_out=$(echo "$input" | jq '.context_window.total_output_tokens')
cr=$(echo "$input" | jq '.context_window.current_usage.cache_read_input_tokens')
cw=$(echo "$input" | jq '.context_window.current_usage.cache_creation_input_tokens')
used_pct=$(echo "$input" | jq '.context_window.used_percentage')
win_size=$(echo "$input" | jq '.context_window.context_window_size')
cwd=$(echo "$input" | jq -r '.cwd')
cost_usd=$(echo "$input" | jq '.cost.total_cost_usd // 0')
user=$(whoami)
host=$(scutil --get ComputerName 2>/dev/null || hostname -s)
now=$(date +%s)

# Transcript metrics: turns, nreq, fr, fr_dip, tw (parsed with jq to avoid grep false positives)
turns=0; _t_nreq=0; _t_fr=0; _t_fr_dip=0; _t_tw=0
if [ -n "$transcript" ] && [ -f "$transcript" ]; then
  _metrics=$(jq -s '
    . as $arr |
    # A "real user turn" excludes Claude Code meta/slash-command entries.
    # Slash commands (/effort, /fast, etc.) and local-command-caveat blocks are
    # written to transcript as type=user string-content entries, and without
    # filtering they inflate $turns and can shift $last_user to a command entry
    # with no assistant response after it — causing the right half of the
    # statusline to collapse to just "ctx" after a user runs /effort.
    def is_real_user: .type == "user"
      and (.message.content | type) == "string"
      and ((.isMeta // false) == false)
      and ((.message.content | startswith("<")) | not);
    ([$arr[] | select(is_real_user)] | length) as $turns |
    (reduce range($arr | length) as $i (null;
      if ($arr[$i] | is_real_user) then $i else . end
    )) as $last_user |
    if $last_user == null then {turns: $turns, nreq: 0, fr: 0, fr_dip: false, tw: 0}
    else
      # All assistant responses after the last user turn, deduped by message.id.
      # fr defaults to first request cache_read ("1R"); if any later request
      # within the turn reads meaningfully less, fr drops to the low-water-mark
      # and fr_dip flips the label to "∧R".
      #
      # Threshold = N_BLOCKS * BLOCK_SIZE (default 3 * 4096 = 12288 tokens).
      # Rationale: Anthropic caches at a fixed block granularity (~4k for Opus
      # 4.x). Claude Code reshuffles its cache_control breakpoints between
      # consecutive requests in a turn, which routinely orphans 1–2 blocks
      # (observed ≤8k drops in real transcripts — normal reorg, not degradation).
      # A drop of ≥3 blocks is outside the normal reorg band and signals real
      # backend cache loss (TTL expiry, LRU eviction). A percentage component
      # was intentionally dropped: reorg cost scales with block_size, not cache
      # size, so a relative threshold would mis-flag routine 1-block reorgs on
      # large caches. Bump N_BLOCKS if you see false positives; lower it if
      # real eviction events are slipping through.
      [$arr[($last_user + 1):] | .[] | select(.type == "assistant" and .message.id)]
      | unique_by(.message.id) as $msgs |
      ($msgs[0].message.usage.cache_read_input_tokens // 0) as $first |
      ([$msgs[] | .message.usage.cache_read_input_tokens // 0] | min // 0) as $mincr |
      (($first - $mincr) >= 12288) as $dip |
      {turns: $turns, nreq: ($msgs | length),
       fr: (if $dip then $mincr else $first end),
       fr_dip: $dip,
       tw: ([$msgs[] | .message.usage.cache_creation_input_tokens] | add // 0)}
    end
  ' "$transcript" 2>/dev/null)
  if [ -n "$_metrics" ]; then
    turns=$(echo "$_metrics" | jq '.turns')
    _t_nreq=$(echo "$_metrics" | jq '.nreq')
    _t_fr=$(echo "$_metrics" | jq '.fr')
    _t_fr_dip=$(echo "$_metrics" | jq 'if .fr_dip then 1 else 0 end')
    _t_tw=$(echo "$_metrics" | jq '.tw')
  fi
fi

# Load state
if [ -f "$STATE" ]; then
  prev_sid=$(jq -r '.sid // ""' "$STATE")
  prev_out=$(jq '.out // 0' "$STATE")
  nreq=$(jq '.nreq // 0' "$STATE")
  fr=$(jq '.fr // 0' "$STATE")
  fr_dip=$(jq '.fr_dip // 0' "$STATE")
  tw=$(jq '.tw // 0' "$STATE")
  ttl=$(jq -r '.ttl // ""' "$STATE")
  ttl_exp=$(jq '.ttl_exp // 0' "$STATE")
  prev_turns=$(jq '.turns // 0' "$STATE")
  last_t=$(jq '.t // 0' "$STATE")
  prev_cost=$(jq '.prev_cost // 0' "$STATE")
  tc=$(jq '.tc // 0' "$STATE")
else
  prev_sid=""; prev_out=0; nreq=0; fr=0; fr_dip=0; tw=0; ttl=""; ttl_exp=0; prev_turns=0; last_t=0; prev_cost=0; tc=0
fi

# Session change → full reset
if [ "$session_id" != "$prev_sid" ]; then
  prev_out=0; nreq=0; fr=0; fr_dip=0; tw=0; ttl=""; ttl_exp=0; prev_turns=$turns; last_t=$now; tc=$cost_usd; prev_cost=$cost_usd
fi

# New turn detected → rebase cost baseline immediately so turn_cost starts at 0.
# We keep nreq/fr/tw at the PREVIOUS turn's values during the "wait gap" (no
# response yet) so the statusline doesn't collapse to just "ctx". Mixed signal
# during the gap (cost=0¢ but stats from last turn) is acceptable: each field
# still reflects something meaningful on its own.
if [ "$turns" -gt "$prev_turns" ] 2>/dev/null; then
  tc=$prev_cost
fi

# Apply transcript-based metrics only when current turn has responses. If no
# responses yet (gap between user submit and first assistant reply), keep
# the previous turn's values visible.
if [ "$_t_nreq" -gt 0 ] 2>/dev/null; then
  nreq=$_t_nreq; fr=$_t_fr; fr_dip=$_t_fr_dip; tw=$_t_tw
fi

# Turn cost = current session total - turn start baseline
turn_cost=$(awk -v a="$cost_usd" -v b="$tc" 'BEGIN{printf "%.6f", a-b}' 2>/dev/null || echo "0")

# Detect new API request (for trace logging and TTL extraction)
if [ "$total_out" != "$prev_out" ]; then
  elapsed=$((now - last_t))
  last_t=$now
  # Extract cache TTL tier from transcript (last assistant message)
  if [ -n "$transcript" ] && [ -f "$transcript" ]; then
    _tier=$(tail -20 "$transcript" | tac | while IFS= read -r _line; do
      _t=$(echo "$_line" | jq -r '.type // empty' 2>/dev/null)
      if [ "$_t" = "assistant" ]; then
        _1h=$(echo "$_line" | jq '.message.usage.cache_creation.ephemeral_1h_input_tokens // 0')
        _5m=$(echo "$_line" | jq '.message.usage.cache_creation.ephemeral_5m_input_tokens // 0')
        if [ "$_1h" -gt 0 ] 2>/dev/null; then echo "1h"
        elif [ "$_5m" -gt 0 ] 2>/dev/null; then echo "5m"
        fi
        break
      fi
    done)
    [ -n "$_tier" ] && ttl="$_tier"
  fi
  # Refresh cache expiration anchor whenever a new request lands — Anthropic
  # refreshes prompt-cache TTL on every read, so `now + tier_duration` is the
  # real-world expiry. Rendered as wall-clock time in the output block below.
  case "$ttl" in
    1h) ttl_exp=$((now + 3600)) ;;
    5m) ttl_exp=$((now + 300)) ;;
  esac
  # Trace: capture full current_usage + cost
  uncached=$(echo "$input" | jq '.context_window.current_usage.input_tokens')
  out_tokens=$(echo "$input" | jq '.context_window.current_usage.output_tokens')
  total_in=$(echo "$input" | jq '.context_window.total_input_tokens')
  echo "$(date '+%Y-%m-%d %H:%M:%S') REQ#${nreq} elapsed=${elapsed}s total_out=${prev_out}->${total_out} | current_usage: R=${cr} W=${cw} U=${uncached} out=${out_tokens} | totals: in=${total_in} out=${total_out} | cost=\$${cost_usd} | state: fr=${fr} tw=${tw}" >> /tmp/claude-sl-trace.log
fi

# Save state (t = last request time, not last poll time)
jq -n --arg sid "$session_id" --argjson out "$total_out" \
  --argjson nreq "$nreq" --argjson fr "$fr" --argjson fr_dip "$fr_dip" --argjson tw "$tw" \
  --arg ttl "$ttl" --argjson ttl_exp "$ttl_exp" \
  --argjson turns "$turns" --argjson t "$last_t" \
  --argjson prev_cost "$cost_usd" --argjson tc "$tc" \
  '{sid:$sid, out:$out, nreq:$nreq, fr:$fr, fr_dip:$fr_dip, tw:$tw, ttl:$ttl, ttl_exp:$ttl_exp, turns:$turns, t:$t, prev_cost:$prev_cost, tc:$tc}' > "$STATE"

# Format path: abbreviate each component except the last to its first letter
# /Users/justin/dev26/colab-runtime-2/colab-cli → ~/d/c/colab-cli
fmt_path() {
  _p="$1"
  _home="$HOME"
  case "$_p" in
    "$_home") echo "~"; return ;;
    "$_home"/*) _p="~/${_p#$_home/}" ;;
  esac
  case "$_p" in
    */*) : ;;
    *) echo "$_p"; return ;;
  esac
  _base="${_p##*/}"
  _dir="${_p%/*}"
  _out=""
  case "$_p" in
    /*) _out="/" ;;
  esac
  _dir="${_dir#/}"
  while [ -n "$_dir" ]; do
    case "$_dir" in
      */*) _seg="${_dir%%/*}"; _dir="${_dir#*/}" ;;
      *)   _seg="$_dir"; _dir="" ;;
    esac
    _first=$(printf '%s' "$_seg" | cut -c1)
    _out="${_out}${_first}/"
  done
  echo "${_out}${_base}"
}

# Format token count (19317 → 19.3k)
fmt() {
  if [ "$1" -ge 1000 ] 2>/dev/null; then
    printf "%.1fk" "$(awk -v n="$1" 'BEGIN{print n/1000}')"
  else
    echo "${1:-0}"
  fi
}

# Format cost (0.1234 → 12¢, 1.234 → $1.23)
fmt_cost() {
  echo "$1" | awk '{c=$1; if(c<0.01) printf "0¢"; else if(c<1) printf "%d¢",c*100+0.5; else printf "$%.2f",c}'
}

# Context: exact used tokens from current_usage.
# Includes output_tokens because the last response is already part of the conversation
# and will be fed as input on the next request. Matches Claude Code's official ctx count.
used_tokens=$(echo "$input" | jq '
  (.context_window.current_usage.input_tokens // 0)
  + (.context_window.current_usage.output_tokens // 0)
  + (.context_window.current_usage.cache_creation_input_tokens // 0)
  + (.context_window.current_usage.cache_read_input_tokens // 0)')

# Output

# TTL tag format: "<tier> <expiry>" — e.g. "1h 17:36:" or "5m :41:40".
# 1h tier shows HH:MM: (wall-clock hour:minute with trailing colon);
# 5m tier shows :MM:SS (leading colon + minute:second of expiry wall-clock).
# Expiry suffix is suppressed if the anchor has already passed (shows bare
# tier instead).
ttl_tag=""
if [ -n "$ttl" ]; then
  ttl_tag=" ${ttl}"
  if [ "$ttl_exp" -gt "$now" ] 2>/dev/null; then
    case "$ttl" in
      1h) ttl_tag="${ttl_tag} $(date -d "@$ttl_exp" "+%H:%M:")" ;;
      5m) ttl_tag="${ttl_tag} $(date -d "@$ttl_exp" "+:%M:%S")" ;;
    esac
  fi
fi

# Cache-read label: "1R" = first request of the turn (warm baseline);
# "∧R" = low-water-mark, flipped when any later request in the turn reads
# fewer cached tokens than the first (signals mid-turn cache degradation).
if [ "$nreq" -gt 0 ]; then
  r_label="1R"
  [ "$fr_dip" = "1" ] && r_label="∧R"
  echo "${user}@${host} $(fmt_path "$cwd") | ctx $(fmt "$used_tokens")${ttl_tag} | ${r_label} $(fmt "$fr") - Rq ${nreq} - ΣW $(fmt "$tw") - $(fmt_cost "$turn_cost")"
else
  echo "${user}@${host} $(fmt_path "$cwd") | ctx $(fmt "$used_tokens")"
fi